Stress a flow
This guide shows you how to simulate one scenario under load.
A stress run is a simulation of the declared flow. It does not call or measure your system. Every number in the result is an estimate.
Before you start
Section titled “Before you start”You need a scenario that plays without issues. See Trace a scenario.
You need the Editor role to save a profile and to run it. A Viewer can read profiles and results.
Create a profile
Section titled “Create a profile”- Open Stress in the left toolbar. The Simulate tab shows the profiles.
- Select New.
- Give the profile a name.
- Select the scenario.
- Check the seed, or give another one. The same seed gives the same result.
A project holds 50 stress profiles at most.
A new profile starts with four values from the Simulation settings of the workspace: the seed, the duration, the warm-up and the arrival rate. On a new instance these are seed 1, 300 seconds, 5 seconds and 10 flows per second. The pattern of a new profile is Poisson. Change each value in the form as you need. The profile keeps the values that you save. A later change of the settings does not change the profile. A workspace owner changes the start values: see Configure a workspace.
State the arrivals
Section titled “State the arrivals”- Select a pattern: Constant, Poisson, Ramp or Burst windows.
- Give the rate in flows per second.
- Give the duration in seconds.
- Give the warm-up in seconds. It must be shorter than the duration. Flows that start during the warm-up are simulated and left out of the statistics.
State the capacity
Section titled “State the capacity”The form lists what the scenario uses. It asks for nothing else.
- For each element under Workers, give the number of workers. Give a queue capacity, or leave it empty for no bound.
- For each entry under Service times, select a distribution and give its values in milliseconds.
- For each subscription under Consumers, give the number of consumers. Give a queue capacity, or leave it empty for no bound.
- For each step under Branch probabilities, give the share of executions that take the
thenpath, from 0 to 1.
Vellum sets no default for these values. A run without one of them is refused, and the message names what is missing.
Timeouts and retries come from the model. To try another value, fill Override timeout, ms, Override attempts or Override backoff, ms. The result lists each override next to the value of the model.
Each value that you enter is saved with the label declared. A service time gets the label measured only when it names an imported k6 result. See Load test with k6.
Add an outage
Section titled “Add an outage”- Select Add an outage.
- Select the target: an element, an operation, a channel or a subscription.
- Give the start and the end of the window in seconds of virtual time.
A stress run does not apply the faults that the scenario declares. Use outage windows.
Run the profile
Section titled “Run the profile”- Select Save and run.
- Read the result.
To run a saved profile again, select Run on the profile in the list. To open a stored run, select the profile and then the run.
The result shows these parts:
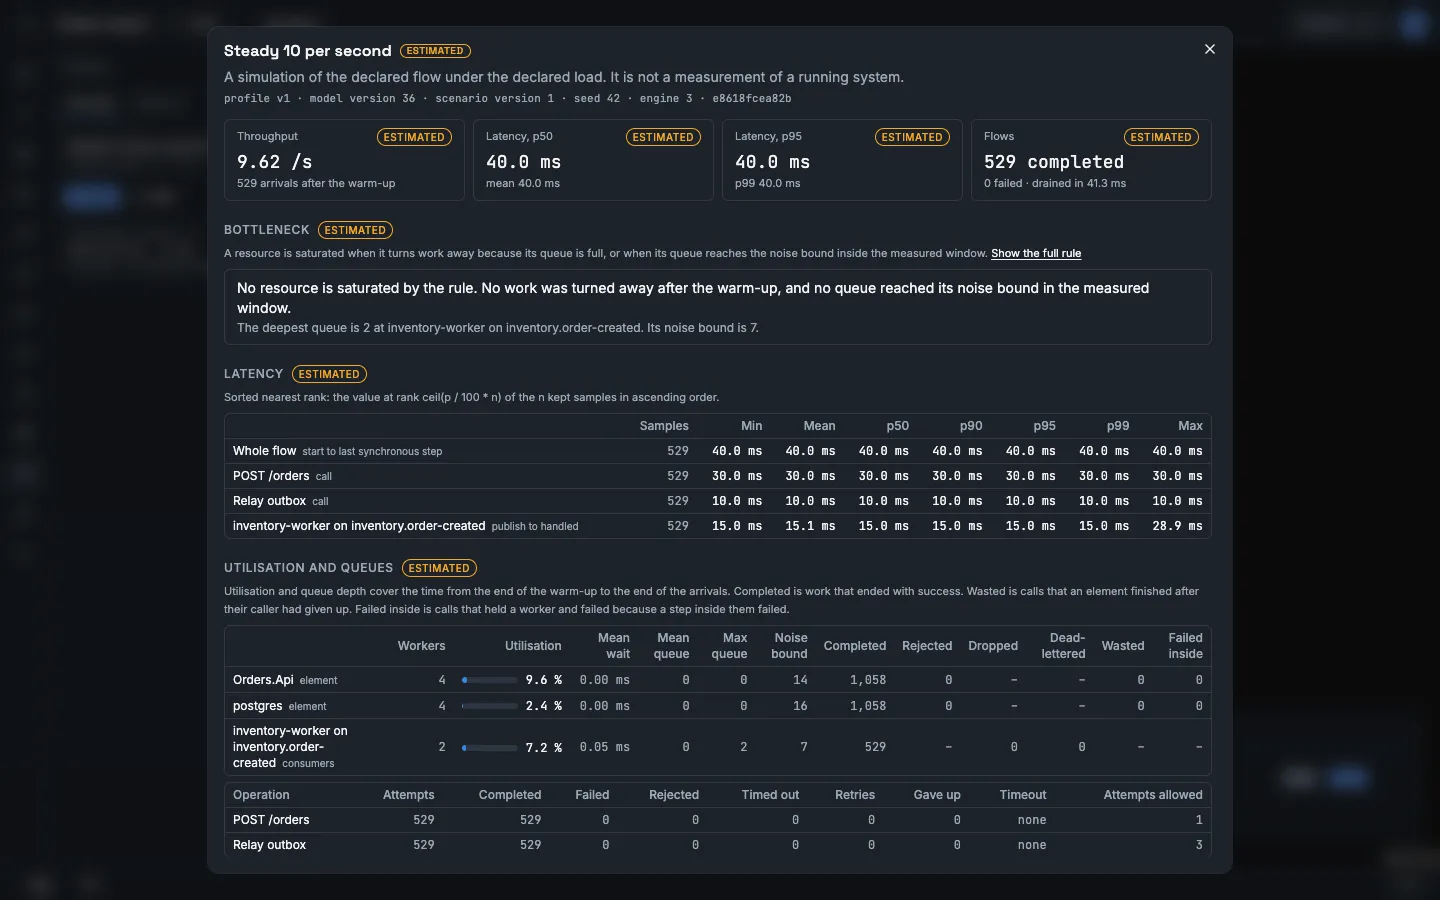
- Headline numbers: throughput, latency percentiles, completed and failed flows, and the time to drain.
- The bottleneck: each saturated resource with the reason, the time window and the numbers. When the rule names no resource, the result says so and gives the deepest queue next to its noise bound. The rule shows in one sentence. Select Show the full rule to read all of it.
- Whether the queue of a saturated resource grows at the end of the arrivals. This is a separate statement.
- A latency table for the flow, each operation and each subscription.
- Utilisation, queue depth and counts for each element and each subscription. Completed is work that ended with success. Wasted and Failed inside are calls that held a worker and are not completed work.
- Charts of arrivals, throughput, queue depth and flows in flight over virtual time.
- Not modelled: the effects that the estimate leaves out.
- Confidence and the rule that sets it.
- Assumptions: every input of the run with its label.
Vellum stores the run. A profile keeps its 20 newest runs. To delete one run, select the bin on its line in the list. To delete the profile and all its runs, select the bin on the profile.
Compare two runs
Section titled “Compare two runs”- Change one input of the profile.
- Select Save and run.
- In the result, go to Compare with another run.
- Select the earlier run in Left side.
The comparison lists the inputs that differ and the difference of each metric. It gives no verdict.
The comparison states whether the two result hashes are equal. Only equal hashes mean the same result.
Keep the seed when you compare. Runs with different seeds differ by chance too.
When a run is outdated
Section titled “When a run is outdated”A stored run names the version of the model and of the scenario that it used. When either changes, the list marks the run outdated. Run the profile again to get a result for the current design.
A stored run also names the version of the profile. When you save the profile again, the result of an older run says that the profile is at a newer version.
A stored run names its engine version too. Stress model gives the current engine version. A run of an earlier engine version keeps the numbers and the bottleneck rule of that version, and the result says so. Run the profile again to apply the current rules.
When a run is refused
Section titled “When a run is refused”- A value is missing. Open the profile and fill the field that the message names.
- The scenario has issues. Correct the scenario first.
- The run is over a limit. Lower the rate or the duration. A run can have 200000 arrivals at most. A run must end in 20 seconds of real time. The stress model lists all limits.
- Too many stress runs. The workspace is at its limit: 2 runs at the same time and 30 runs in one minute. Wait the stated number of seconds.
- The instance is busy with other stress runs. The instance is at its limit for all workspaces. The limit is 4 runs at the same time, unless the instance administrator changed it. Wait the stated number of seconds. The instance administrator changes the limit under Settings → Instance → Stress runs at the same time: see Configure a workspace.
A refused run stores nothing.
See also
Section titled “See also”- Stress model for the rules of the simulation, the limits and the endpoints.
- Estimates are not measurements for what a stress result means.
- Load test with k6 to measure a deployed system and to compare the measurement with a run.